What is a Loss Run Report
By SortSpoke
Published August 7, 2026 | Updated August 12, 2026
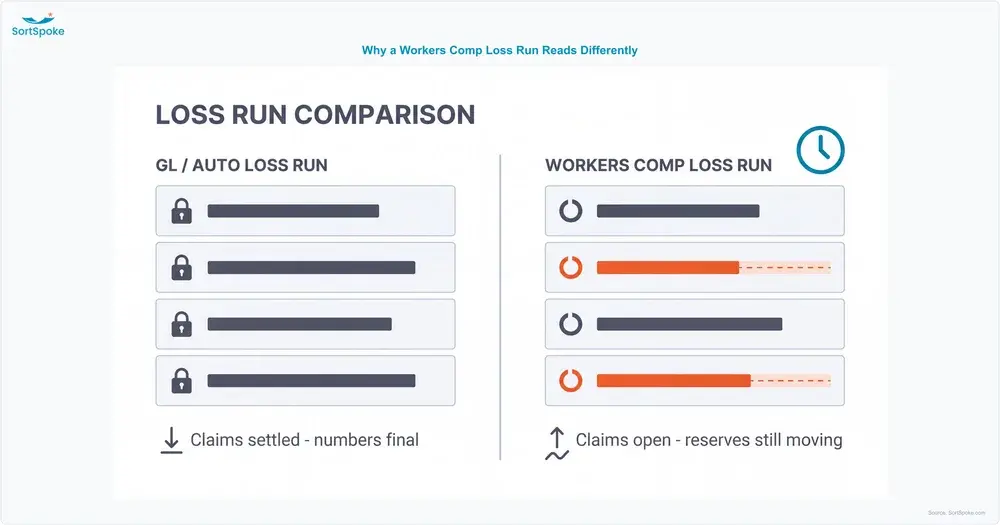
A workers' compensation (workers comp) loss run doesn't get read the way a general liability or auto loss run does — and the difference isn't cosmetic. On most lines, a loss run is a rearview mirror: the claims are settled, the numbers are final, and the underwriter is reading history. On a workers comp loss run, a meaningful share of the claims aren't finished when the report is printed. Reserves are still moving. Claimants are still in treatment. And the number the underwriter ultimately cares about — the employer's experience modification factor — is still being calculated off claims that haven't closed yet.
That's why workers comp loss runs get more scrutiny, take longer to read correctly, and carry more pricing consequence than almost any other line in the submission. This guide covers what a workers comp loss run actually shows, why the line behaves so differently from GL or auto, how underwriters turn raw claim rows into a loss analysis summary, the red flags that summary should surface, and where the multi-carrier format problem makes all of it harder.
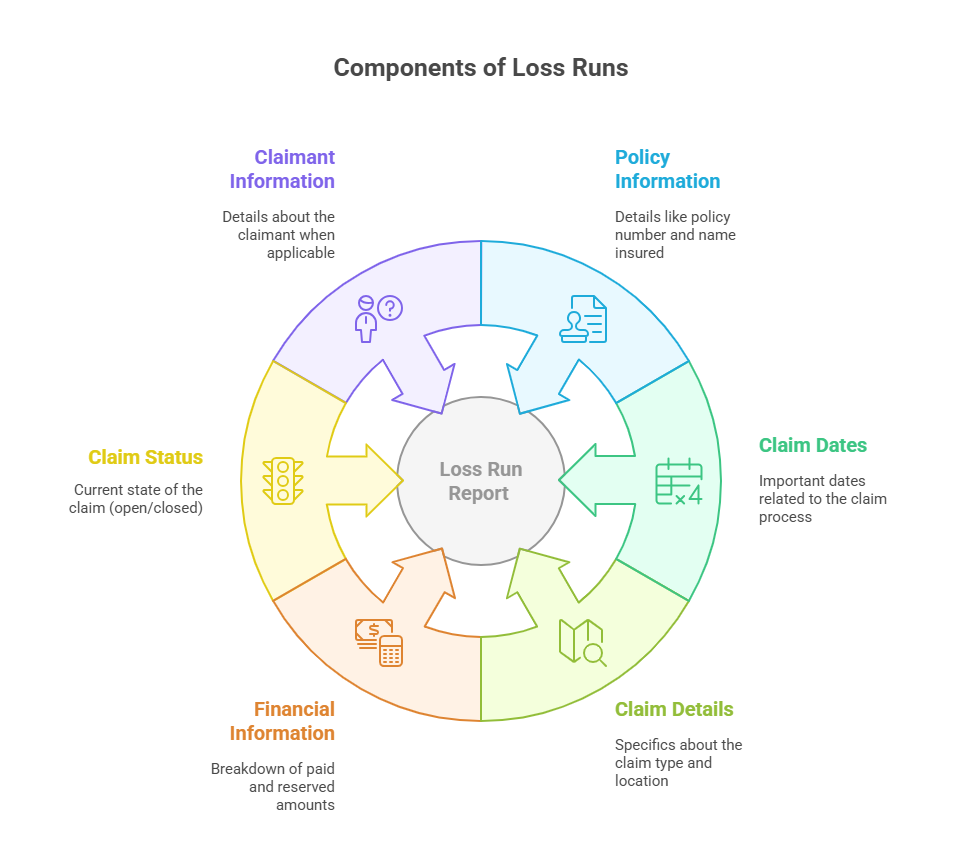
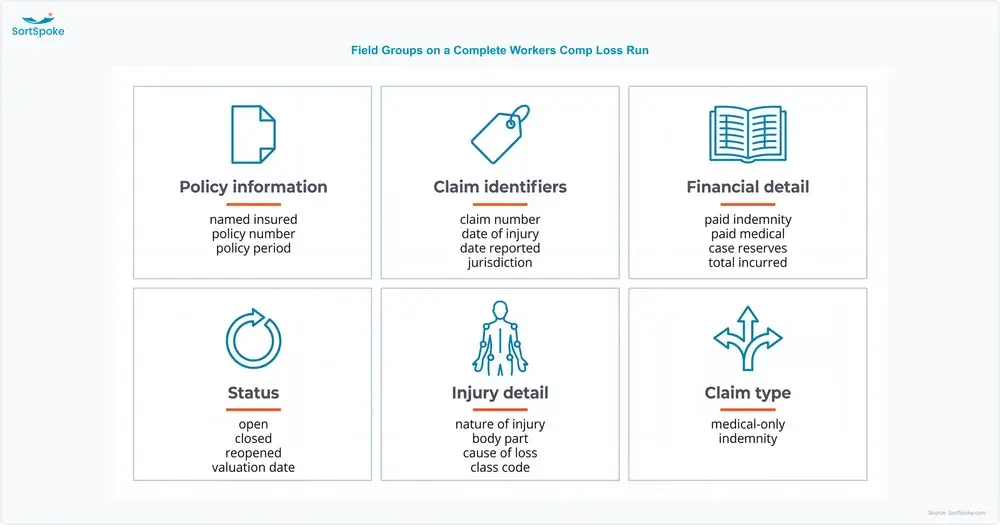
A workers comp loss run lists every claim filed under the policy, with a consistent set of claim-level fields repeated for each entry. The exact layout varies by carrier, but the core data is the same:
Core Fields on a Workers Comp Loss Run
Body part and nature of injury are worth calling out specifically, because they're what makes a workers comp loss run read differently from the start. A GL loss run tells you what happened to a third party. An auto loss run tells you about a vehicle incident. A workers comp loss run tells you about an injured employee — which is also why WC claims tend to stay open longer than claims on almost any other line, a theme that runs through the rest of this guide.
The seven fields above are the ones every workers comp loss run carries. A complete report — the kind an underwriter can price from without a follow-up email — carries more. Carriers organize these differently and label them inconsistently, but the underlying data set is stable across the market.
| Field Group | Fields | Why the Underwriter Needs It |
|---|---|---|
| Policy information | Named insured, policy number, policy period/term, carrier of record for each period | Confirms the report covers the full experience window, and identifies gaps where a prior carrier's loss run is still missing |
| Claim identifiers | Claim number, date of injury, date reported to employer, date reported to carrier/TPA, jurisdiction/state | Two separate report dates isolate whether a lag came from the employee, the employer, or the carrier — a distinction that changes the loss-control conversation entirely |
| Financial detail | Paid indemnity, paid medical, paid expense (ALAE), case reserves, total incurred | Splitting paid indemnity from paid medical shows whether cost is driven by lost work time or by treatment — the two respond to completely different interventions |
| Status | Open, closed, or reopened, plus the valuation date the financials were pulled | Reopened claims are invisible if the report only shows open/closed, and a stale valuation date makes every reserve figure on the page provisional |
| Injury detail | Nature of injury, body part, cause of loss, NCCI/state class code for the injured worker | Class code ties the injury back to the job being performed, which is how an underwriter tells a misclassified payroll problem from a genuine hazard |
| Claim type | Medical-only vs. indemnity (lost-time) | Drives litigation risk, return-to-work assessment, and — as covered below — the experience mod calculation itself |
When a submitted loss run is missing a column from this list, the practical move is to ask for it rather than infer it. Backing into a medical-only/indemnity split from claim size, or into a cause of loss from a free-text description field, produces a summary that reads authoritative and is quietly wrong.
The same rule holds anywhere automated document processing is doing the first read: a field that was never captured cannot be recovered downstream, and an inferred value is harder to audit than a missing one.
Every line of business has a loss run. Workers comp is the one where getting the read right carries the most weight — for several connected reasons.
Workers comp is the one line where an insured's own claims history feeds directly into a standardized pricing formula: the experience modification factor, or "experience mod." NCCI's experience rating framework compares an employer's actual loss experience over a set period against the average losses expected for similarly classified businesses, producing a mod that adjusts the manual rate up or down. A mod below 1.0 lowers premium; a mod above 1.0 raises it.
Because the mod calculation draws on multiple policy years of claims — many of which may still be open — the loss run isn't just informational on workers comp. It's a direct input into a number that will move the employer's price regardless of which carrier ultimately writes the account.
The experience mod does not treat every dollar of loss equally. NCCI's experience rating plan divides each individual claim at a split point: the portion of the claim below the split point is a primary loss, and the portion above it is an excess loss. Primary losses are weighted far more heavily in the mod formula than excess losses, because frequency is a more stable predictor of future cost than severity.
Per NCCI's experience rating methodology FAQs, the split point is a countrywide value of $18,500 that is updated with each state's annual loss cost/rate filing, with NCCI's proposed methodology moving toward state-specific split points reflecting each state's claim severity. Because the value is indexed and varies by filing, treat the exact figure as something to confirm against the current filing for the state in question rather than a constant.
The practical consequence surprises people: five $18,000 claims move the mod more than one $90,000 claim, even though both total $90,000. The five smaller claims are almost entirely primary loss. The single large claim contributes $18,500 of primary loss and pushes the remaining $71,500 into the excess layer, where it barely registers by comparison. This is why a loss run showing a scatter of moderate strain and sprain claims can price worse than one showing a single catastrophic injury — and why "we only had one bad claim" is often a weaker defense than the employer believes.
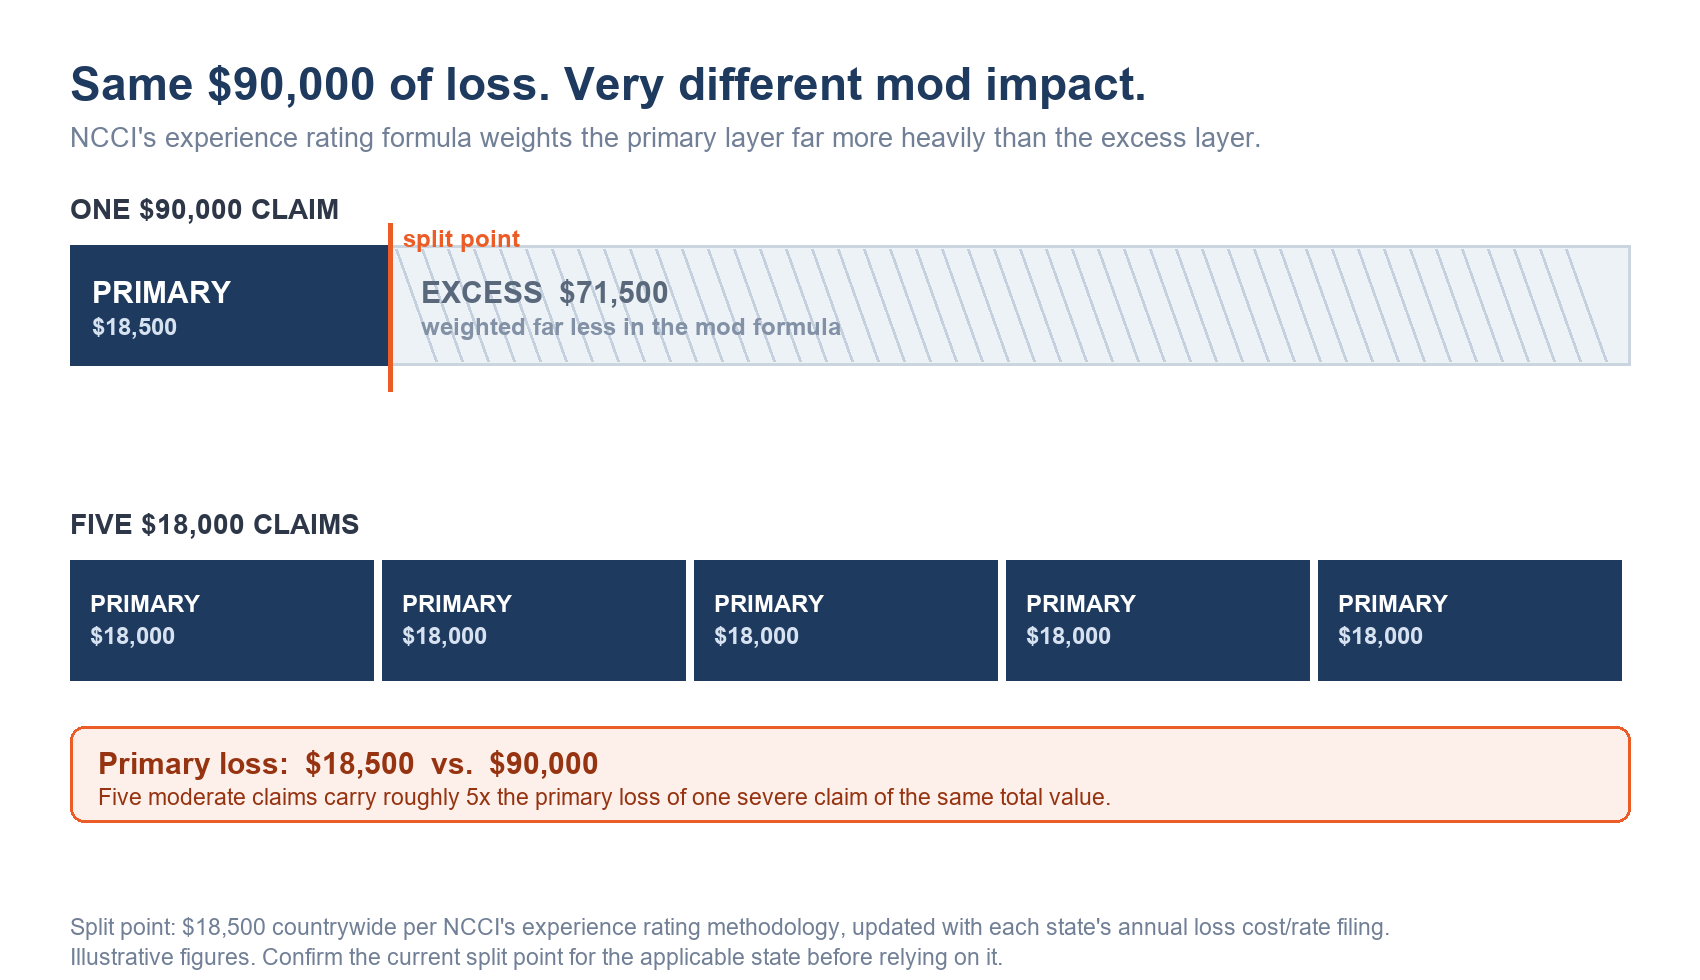
The same $90,000 of incurred loss, split two ways. Only the primary layer carries full weight in the experience mod formula — so five moderate claims contribute roughly 5× the primary loss of one severe claim.
Medical-only claims — where the employee received treatment but lost no compensable work time — are discounted in the mod calculation. NCCI's experience rating adjustment reduces medical-only losses by 70%, so only 30% of the claim counts toward the mod.
That discount is why the medical-only versus indemnity split is a pricing field, not just a severity descriptor. An employer whose claim count looks alarming may be carrying mostly medical-only claims that are largely discounted out of the mod. Another employer with half the claim count, but a high lost-time share, can carry the worse mod. A loss analysis summary that reports total claim count without this split has omitted the variable that most changes the pricing conclusion.
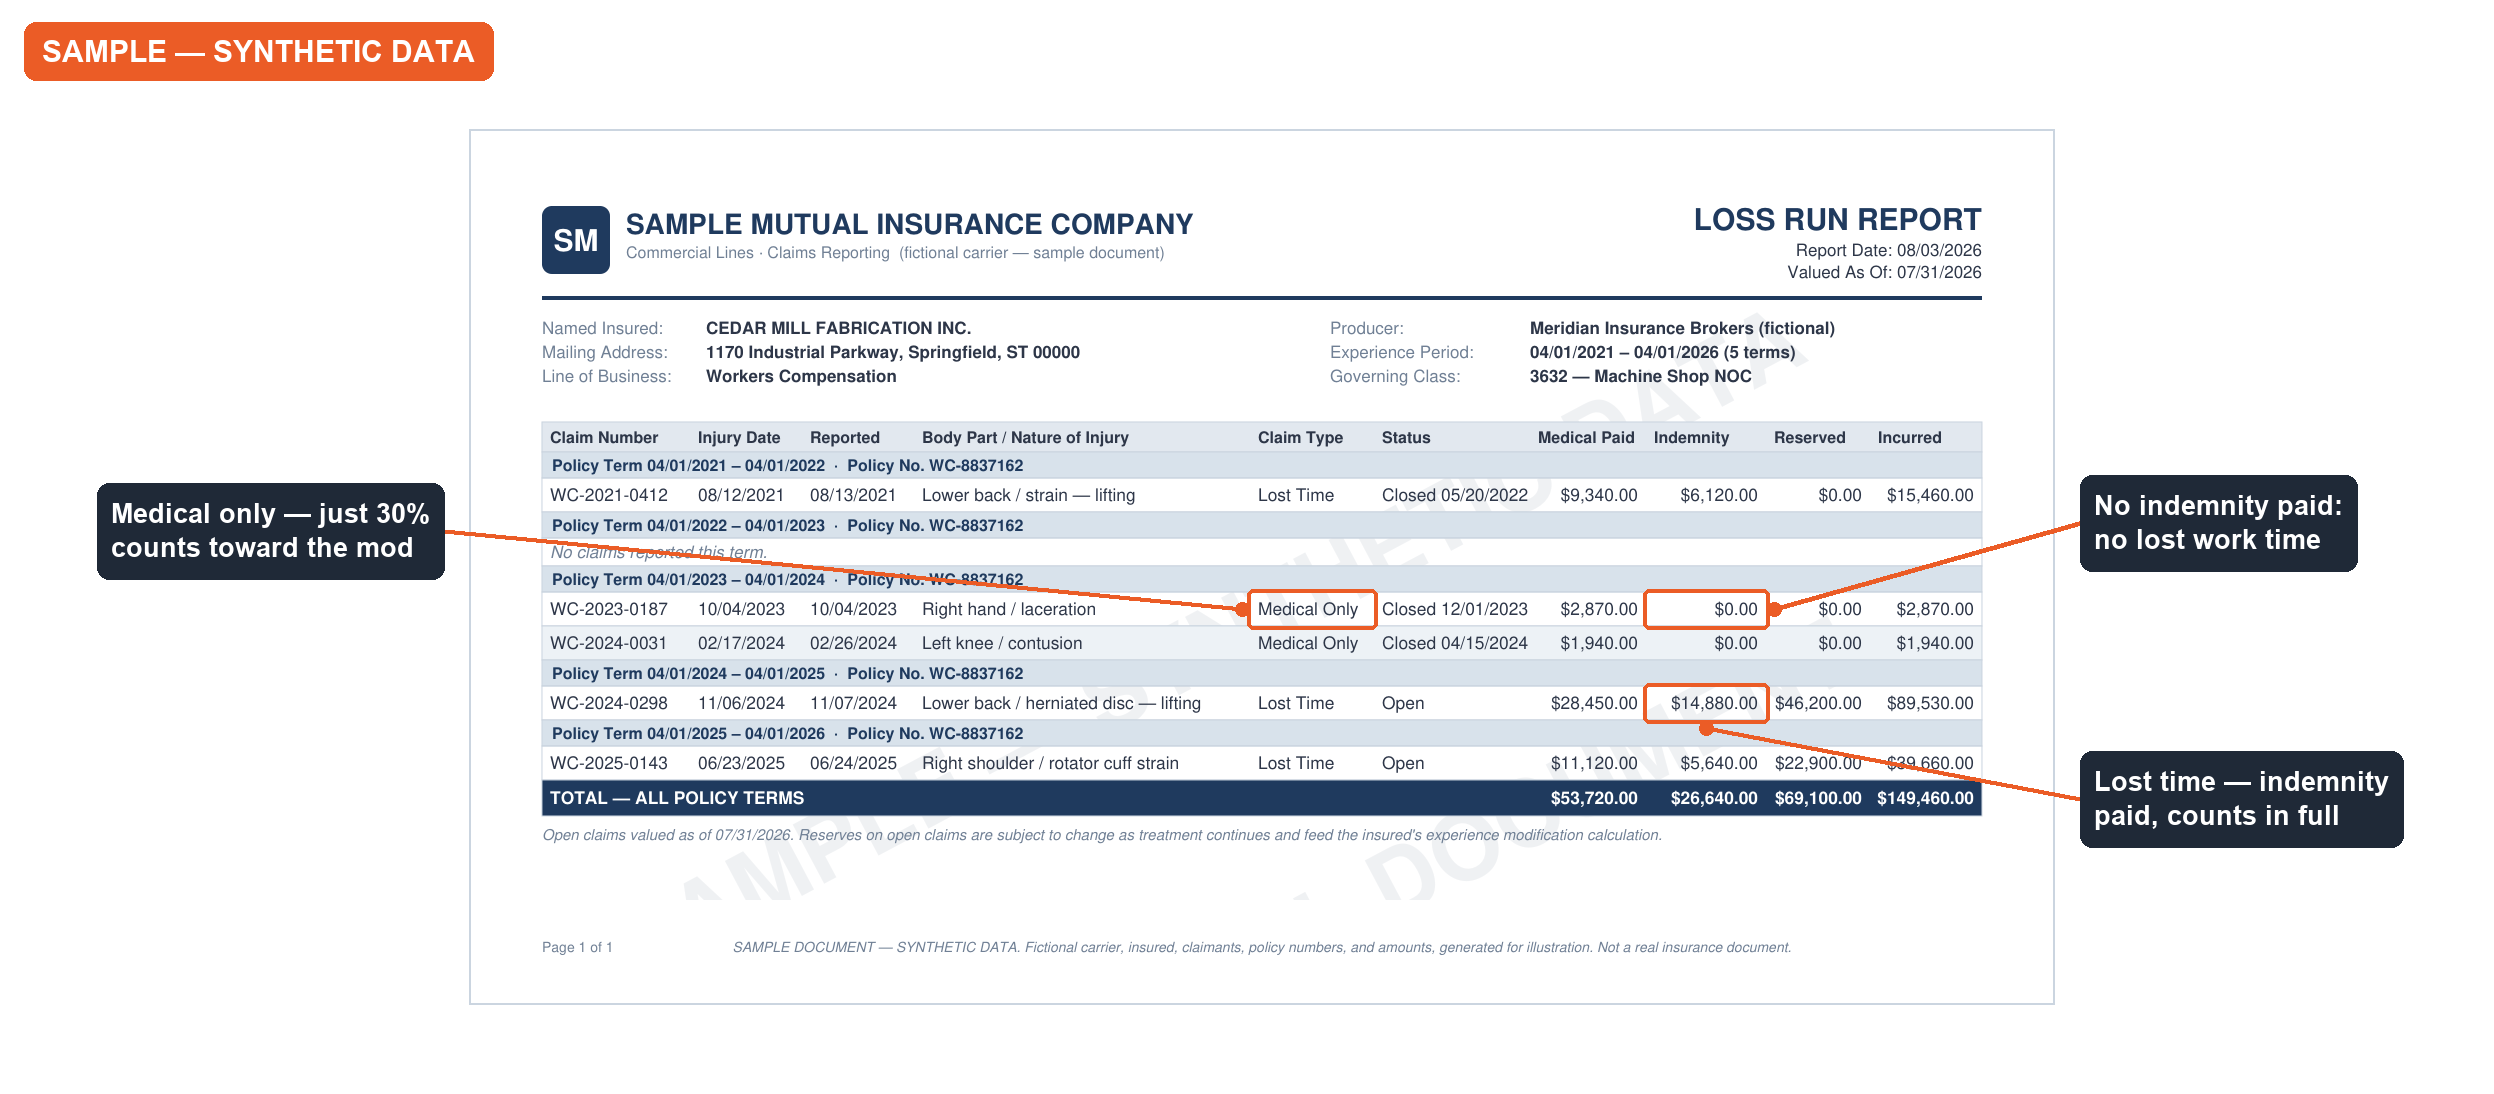
The medical-only/indemnity distinction as it appears on an actual loss run (synthetic sample — fictional carrier, insured, and claim data). On medical-only claims the indemnity column is $0.00; on lost-time claims it isn't.
A common underwriting rule of thumb puts lost-time claims at roughly 20-25% of total workers comp claim count. Well above that range, underwriters typically read a return-to-work problem: the employer has no modified-duty program, so injuries that could have been medical-only become indemnity claims. That is a diagnosis with a specific remedy, which makes it one of the more actionable findings a loss summary can surface.
On a GL claim, once a settlement is reached, the claim is typically paid and closed — the number is final. Workers comp claims don't resolve that cleanly. A claimant can remain in active medical treatment for months or years after the injury date, which means the reserve on that claim keeps moving as treatment continues, as return-to-work status changes, or as a claim reopens after a period of apparent closure.
That's why a workers comp loss run's open claims deserve more attention than its closed ones. A large open reserve isn't a settled fact — it's the carrier's current best estimate of a cost that's still developing.
Some categories of workers comp injury are inherently long-tail: back injuries with recurring treatment, occupational disease claims where onset is gradual, and claims that appear closed and then reopen when a claimant's condition changes. These claims can stay on a loss run — open or recently reopened — for years after the original injury date, which is part of why underwriters typically want more history on workers comp than they do on faster-resolving lines.
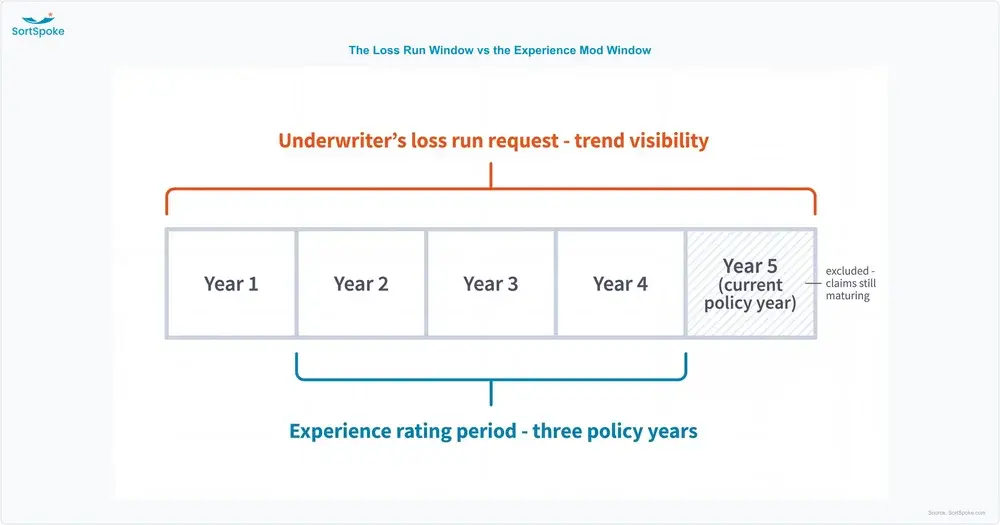
Most underwriters request 5 years of workers comp loss run history as a baseline — enough to see whether frequency and severity patterns are improving, stable, or getting worse, and enough runway to catch long-tail claims as they develop. That's a broader window than the experience mod calculation itself uses: NCCI's experience rating plan draws on a three-policy-year experience period, excluding the most recent policy year to give claims time to mature before they're counted. The 5-year loss run request is about trend visibility for the underwriter — it isn't meant to mirror the mod formula's own window.
For employers with severe or long-tail exposure — recurring back injuries, occupational disease claims, or a history of claims that reopen — some underwriters extend the request to 7-10 years, specifically to see how those claims developed rather than judging them at a single point in time. If you need the full mechanics of a loss run request (timelines, what to include, how to handle multiple prior carriers), the definitional guide to loss run reports covers that ground in detail, and how to get a loss run report includes a request letter template — this section is scoped to what's specific about the workers comp version of that request.
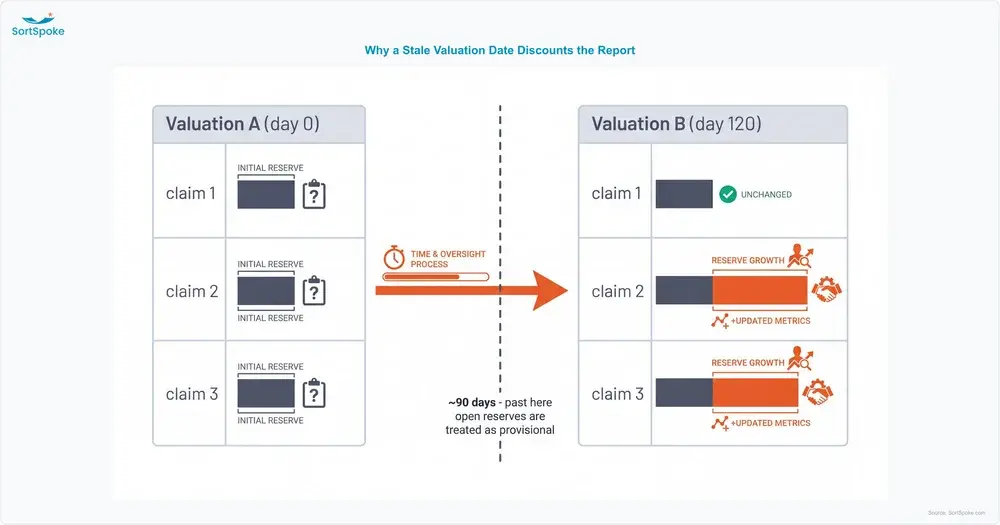
A currently valued loss run is one stamped with a recent valuation date, showing what every claim is worth — paid plus reserves — as of that specific date. Underwriters insist on it for workers comp because reserves on open WC claims move continuously as claimants remain in treatment, so the report is a snapshot of a moving number rather than a settled record.
The working threshold most underwriting teams apply is roughly 90 days. Past that, the open reserves on the report are treated as directionally useful but not reliable, and the underwriter either requests a refreshed valuation or prices in the uncertainty. This is a sharper standard than other lines face: a general liability or auto loss run valued six months ago is usually still serviceable, because settled claims don't move. Workers comp reserves do.
Comparing two loss runs at different valuation dates is also the cleanest available test of reserve development. If the same claims are worth materially more at the later valuation, reserves are developing upward and the current incurred figures are likely still understated.
Raw claim rows aren't what an underwriter prices from. The working product is a loss analysis summary: a period-by-period table that converts claim-level transaction history into the trend signals behind three questions — is frequency getting better or worse, is severity escalating, and how much of the cost picture is still open and uncertain.
The backbone of that summary is one table, built per policy period:
| Policy Period | Claims | Paid | Reserve | Incurred | Avg. Incurred |
|---|---|---|---|---|---|
| 2021-22 | 14 | $118,400 | $0 | $118,400 | $8,457 |
| 2022-23 | 11 | $62,900 | $0 | $62,900 | $5,718 |
| 2023-24 | 16 | $141,200 | $9,500 | $150,700 | $9,419 |
| 2024-25 | 15 | $96,300 | $214,000 | $310,300 | $20,687 |
| 2025-26 | 7 | $28,700 | $86,500 | $115,200 | $16,457 |
Illustrative five-year summary using synthetic figures, structured the way carrier-market loss analysis reports present it.
Assembled into a finished document, that table sits alongside the claim-type split, cause-of-loss ranking, reporting-lag distribution, and a short narrative — the structure carrier and agency loss analysis products converge on:
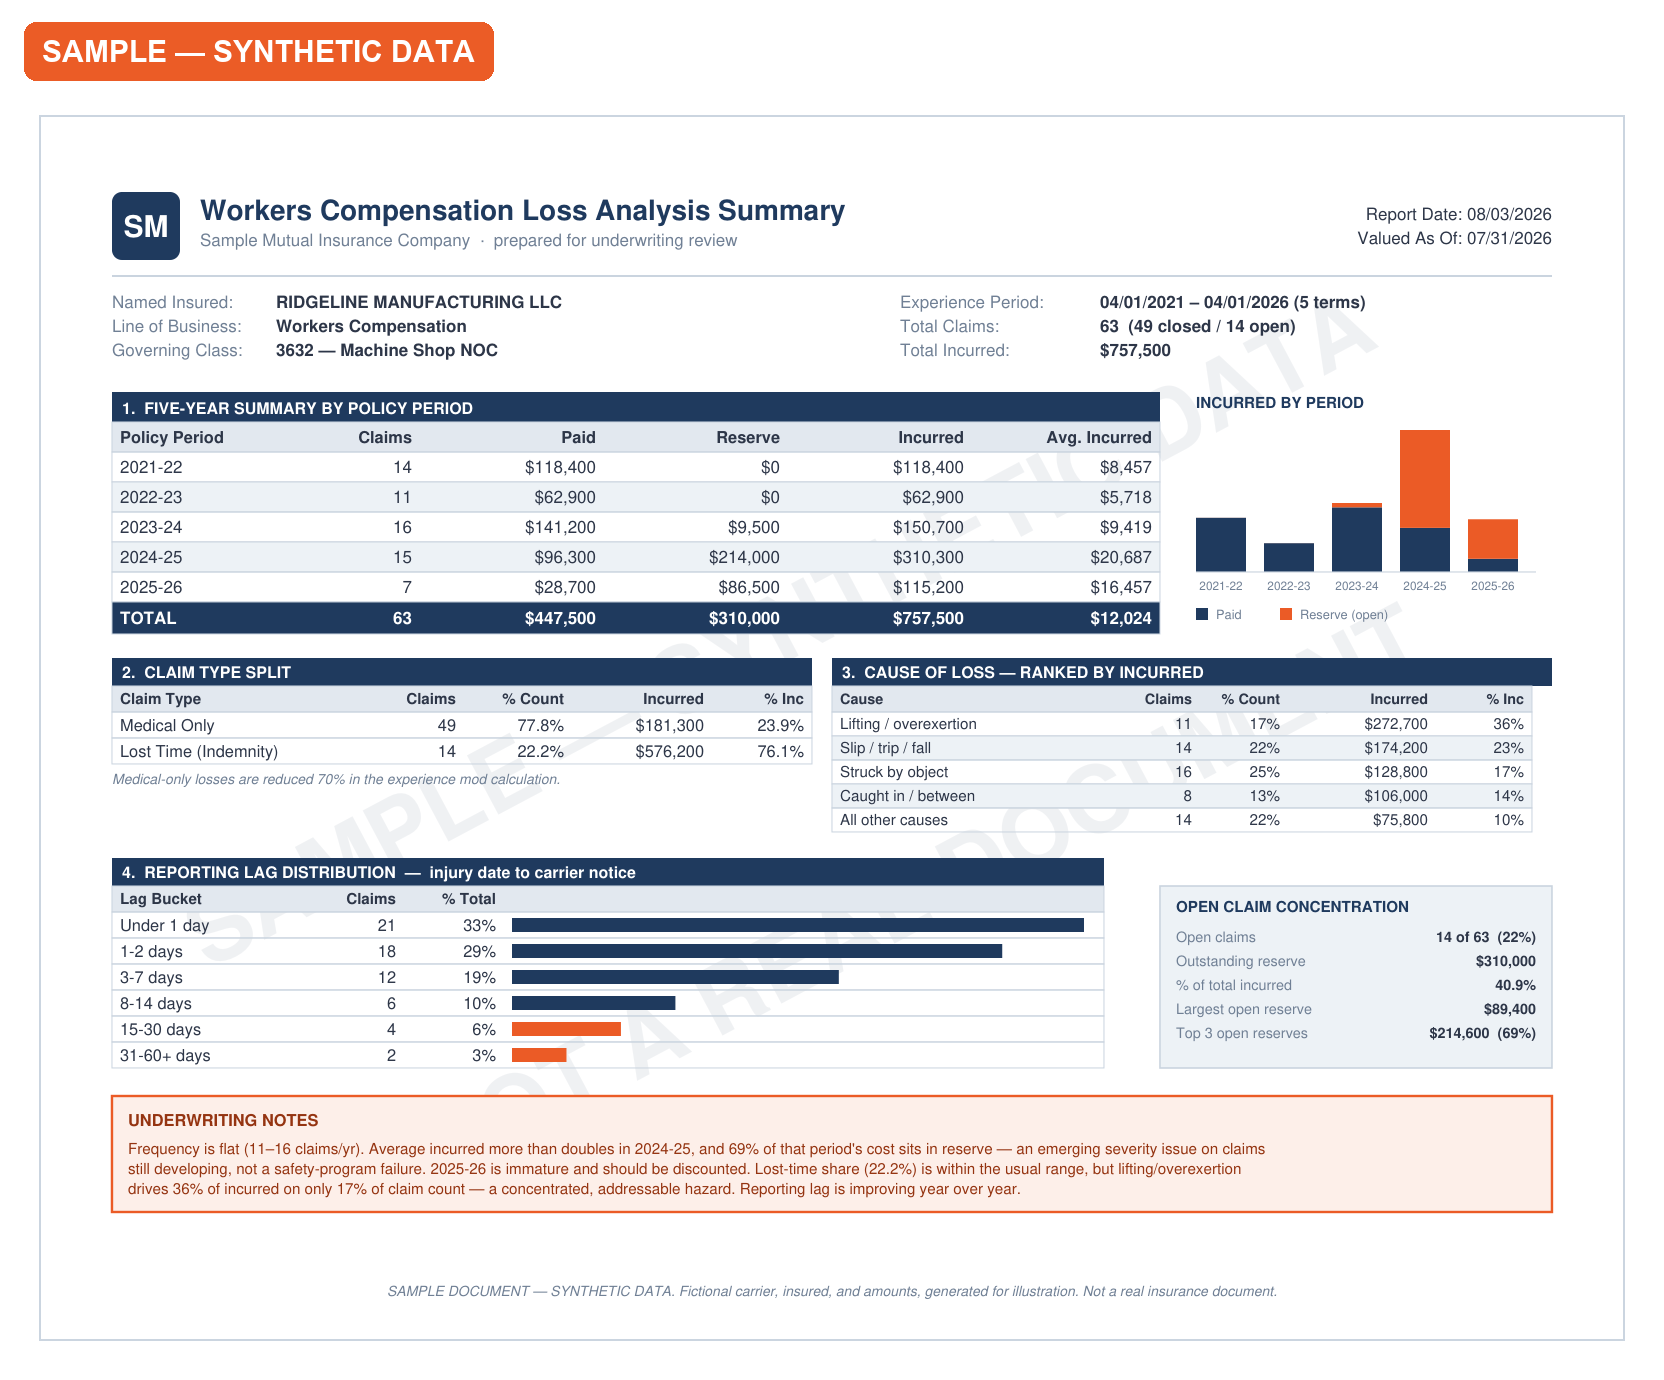
An example workers compensation loss analysis summary (synthetic sample — fictional carrier, insured, and claim data). The five-year table above is section 1; everything else on the page exists to explain what that table is showing.
Read across the rows and the account tells a specific story. Claim count is flat — 11 to 16 per year, no frequency deterioration. But average incurred more than doubles in 2024-25, and almost all of that increase sits in reserve rather than paid. That is an emerging severity problem on claims that have not finished developing, not a safety-program collapse. The 2025-26 row looks better on every measure, and should be discounted accordingly: it's the immature year, with claims still being reported and reserves still being set.
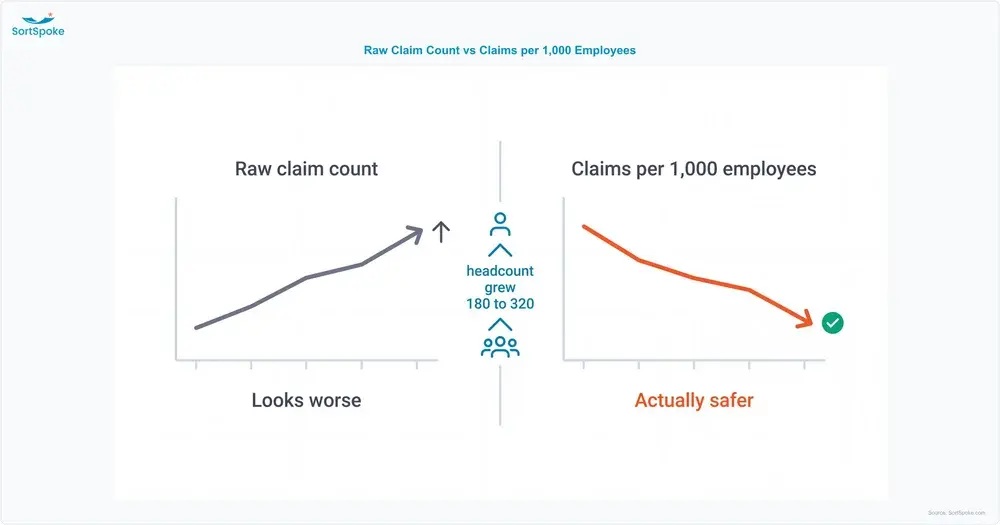
Raw claim counts mislead whenever headcount changed. An employer that grew from 180 to 320 employees across the period will show rising claim counts while actually getting safer. Public-sector loss analysis templates handle this by converting to rate-based metrics — claims per 1,000 employees and cost per 1,000 employees — which makes years comparable to each other and to an external benchmark.
Where payroll by class code is available, exposure-based normalization is stronger still, since it weights for the hazard of the work rather than just the number of people doing it. Either way, the point is the same: a trend line drawn through unnormalized claim counts measures company growth as much as it measures risk.
Reading a workers comp loss run well means separating two different risk signals that can look similar on a summary total but mean very different things.
A frequency problem looks like multiple small claims recurring year over year — strain and sprain injuries, minor lacerations, claims in the $2K-$10K range showing up three or four times annually. Frequency at that level usually points to an operational or safety-program issue rather than bad luck, and it tends to move pricing even when no single claim is large — which, given the primary/excess weighting described above, is exactly what the mod formula is built to punish.
A severity problem looks different: one large claim, often with a substantial reserve still open, tied to an injury where the claimant remains in treatment. A single severe claim on an otherwise clean loss run gets evaluated on its own circumstances — was it a one-time event or a sign of a systemic exposure — but the size of the open reserve drives how cautiously the underwriter prices around it.
Beyond frequency and severity, underwriters also check reserve adequacy: do the final paid amounts on closed claims track reasonably close to what was initially reserved, or is there significant drift? A workers comp loss run where reserves consistently under- or over-shoot final paid amounts suggests the carrier's claims handling — not just the employer's risk — deserves a second look.
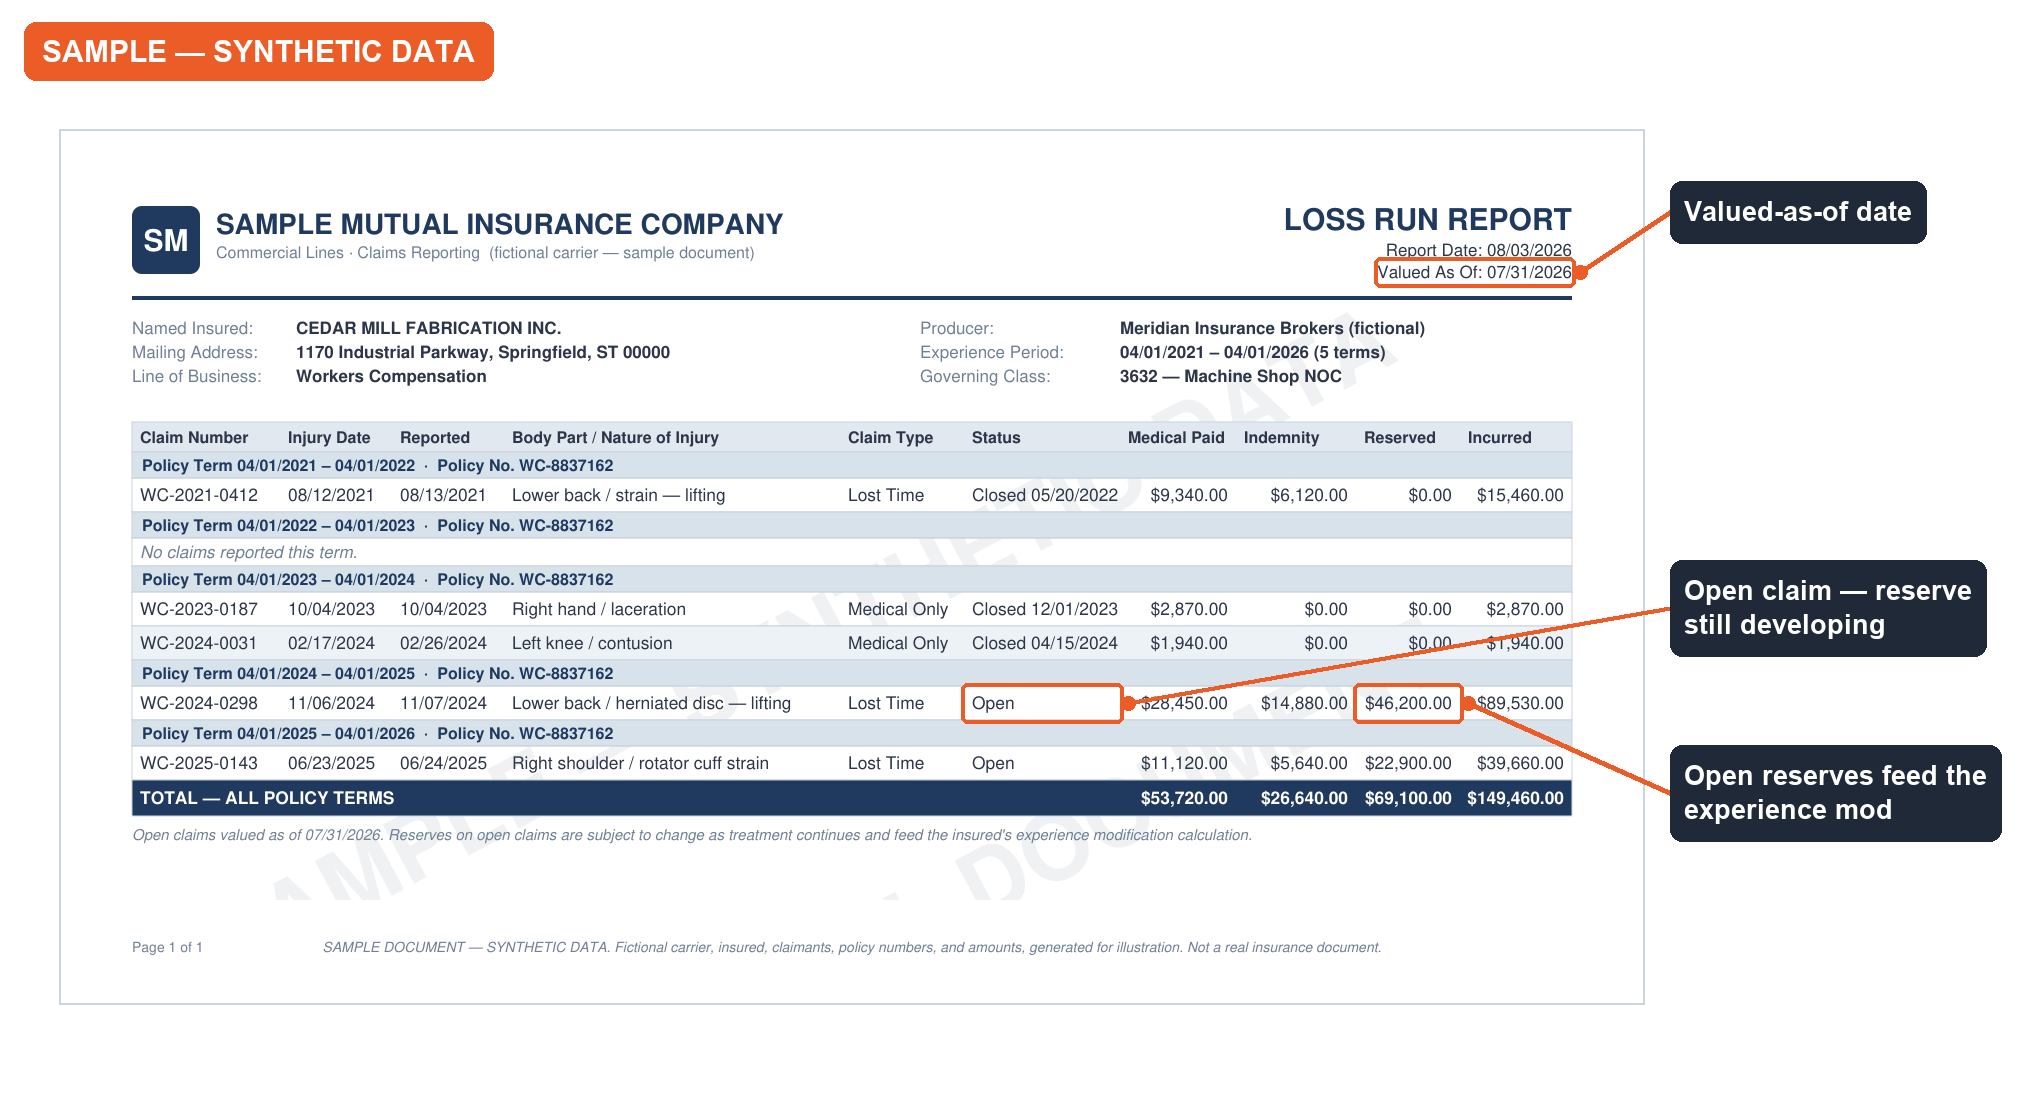
An example workers compensation loss run (synthetic sample — fictional carrier, insured, and claim data). Note the open lost-time claim carrying a large reserve — the entry underwriters scrutinize most.
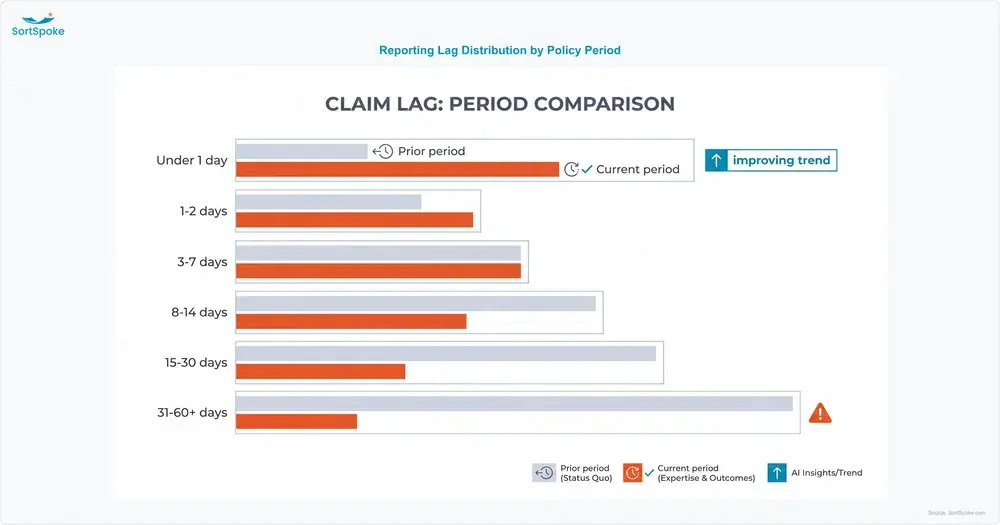
Reporting lag is the gap between the date of injury and the date the claim reached the carrier, and underwriters read it as a proxy for safety culture and claims-handling discipline. Late-reported workers comp claims cost more: the injured employee has had longer without guided care, the facts are harder to establish, and litigation becomes materially more likely.
The standard presentation is a distribution across buckets, trended by policy period:
An improving trend — mass moving toward the shorter buckets year over year — is a real negotiating asset at renewal. A flat or worsening trend is a loss-control talking point, and one of the few findings in a loss summary the employer can act on immediately.
Ranking claims by cause of loss — lifting and overexertion, falls and slips, struck-by, caught-in — by both incurred dollars and claim count is what turns a loss summary from a scorecard into a diagnosis. The two rankings usually disagree, and the disagreement is the finding.
When lifting and overexertion accounts for, say, 36% of incurred dollars but only 17% of claim count, the exposure is severity-driven and concentrated in a specific, addressable hazard. That points somewhere concrete: material handling practices, lift assists, job rotation. Drilling the top two or three causes into nature-of-injury (strains, lacerations, fractures) and body part (back, knee, shoulder, finger) sub-breakdowns is what makes the recommendation specific enough to act on.
Two tenure-related patterns are worth isolating because both have specific causes and specific fixes.
Injuries occurring within a worker's first 90 days of employment typically point to onboarding and training gaps rather than inherent job hazard — a high share of short-tenure claims is one of the clearest training-program signals available in loss data. Separately, repeat claimants, meaning employees with more than one claim in a year, warrant direct discussion with the employer: the cause is either a genuinely hazardous role that needs re-engineering, or an individual situation that needs its own handling. Either way, a summary that surfaces the pattern gets a better conversation than one that leaves it buried in the claim rows.
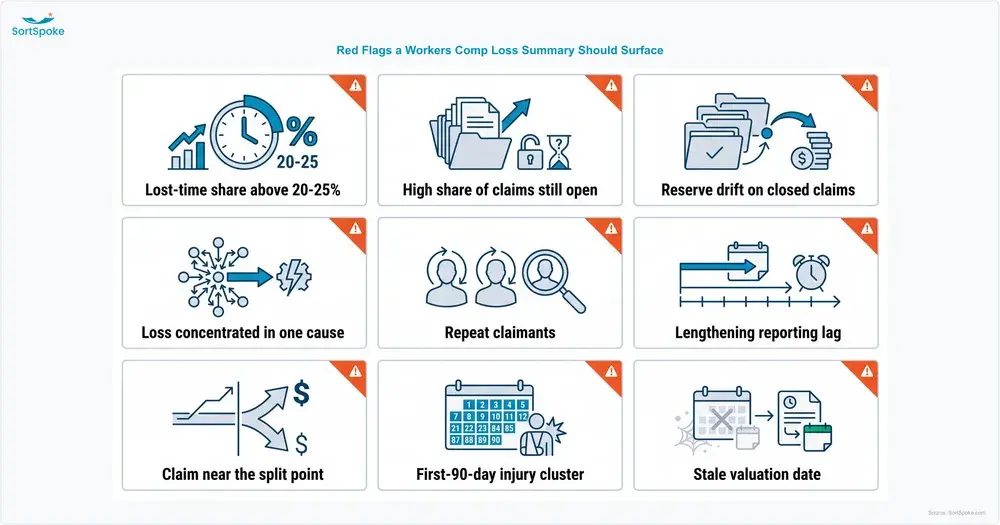
A good loss analysis summary doesn't just present data — it flags the specific signals that change an underwriting decision. These are the patterns underwriters look for, and what each one indicates:
| Signal | What Underwriters Read Into It |
|---|---|
| Lost-time claims well above the ~20-25% rule of thumb | Weak or absent return-to-work program — injuries that could stay medical-only are becoming indemnity claims |
| High share of claims still open relative to policy age | Slow claims resolution and rising cost uncertainty; incurred totals are probably still understated |
| Reserve development drift on closed claims | Reserving or claims-handling quality issue — the carrier's numbers, not just the employer's risk |
| Loss concentrated in one cause-of-loss or body-part category | A specific, addressable hazard exposure rather than diffuse bad luck |
| Repeat claimants with two or more claims in a year | Either a hazardous role needing re-engineering or an individual training/placement issue |
| Long or lengthening reporting lag | Weak safety-reporting culture and elevated litigation risk |
| High litigated-claim percentage | Distrust or process breakdown around claims handling, which inflates cost independent of injury severity |
| A single claim sitting near or above the primary/excess split point | Disproportionate mod and pricing impact relative to its share of total incurred |
| Cluster of injuries within employees' first 90 days | Onboarding and training gap rather than inherent job hazard |
| Valuation date more than ~90 days old | Open reserves are stale; every severity conclusion on the report is provisional |
Every carrier's workers compensation loss run report looks different. Some list body part and nature of injury as separate columns; others combine them into a single description field. Some show reserves as a standalone figure; others only surface a combined incurred total. There's no standardized workers comp loss run request format the way there is for an ACORD form, so each carrier's version has to be read on its own terms.
Reading every format on its own terms is precisely the work intelligent document processing exists to absorb — mapping a differently labelled column back to the same underlying field without anyone re-keying it.
Multi-state employers compound this. It's common for workers comp coverage to be split across multiple carriers by state — one carrier for the home state, others for satellite locations — which means a single submission can arrive with several carriers' formats to reconcile into one coherent picture of frequency, severity, and reserve trend. That reconciliation is where the summary work actually lives: before anyone can build the five-year table above, the same field has to be located under a different label in every source document, and medical-only has to be identified consistently even when one carrier flags it explicitly and another leaves it to be inferred from an empty indemnity column. Comparing loss run processing tools is one way teams evaluate options for handling that reconciliation at scale, whether the current approach is manual, templated, or outsourced.
The reconciliation problem is not specific to workers comp either. Every document class in the submission carries some version of it, which is why teams usually solve it once at the submission intake layer rather than rebuilding a separate process per document type.
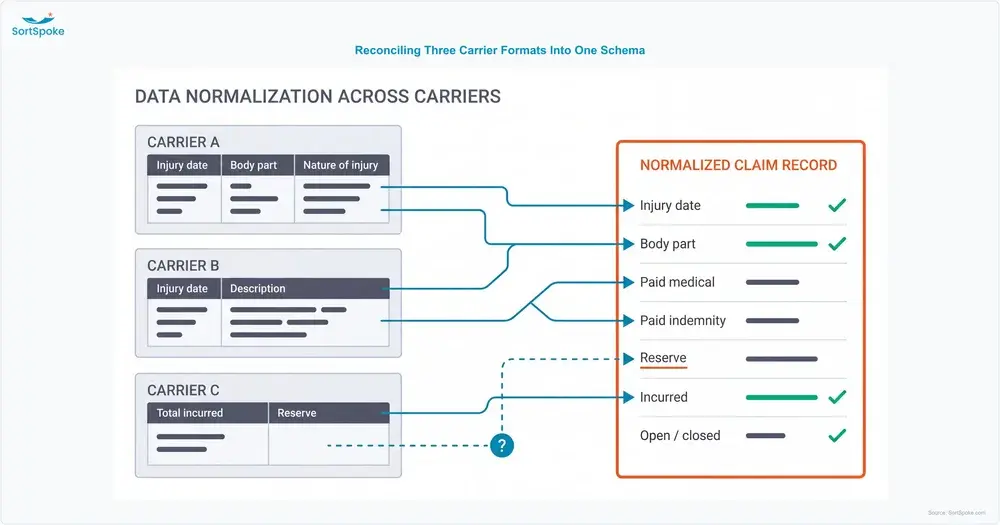
Reading one workers comp loss run carefully is manageable. Reading dozens per week, each in a different carrier's format, with claim-level fields like body part, reserve, medical-only flag, and open/closed status scattered across different column layouts, is where manual review starts to compound risk rather than reduce it. Per-step accuracy isn't the same as a reliable end-to-end result — the more extraction and classification steps a WC submission requires, the more a small per-step error rate compounds into a materially wrong picture of the claim.
At that volume the WC loss run stops being a reading problem and becomes a submission triage problem: it is one attachment among many in the submission, and typically the slowest to work through. Handling it inside an intelligent document processing platform is what keeps a per-step error rate from compounding, because every field carries its own confidence score rather than inheriting a document-level one.
SortSpoke's loss run data extraction is built for that reality: claim-level fields — injury date, body part, paid indemnity, paid medical, reserved, incurred, open/closed status — pulled automatically across carrier formats, with greater than 95% real-world extraction accuracy on loss run documents, measured against actual production data across varied carrier formats, layouts, and document qualities. The point isn't a number in isolation; it's what backs it. Every extracted field either clears the confidence threshold the underwriting team sets, or it routes to the team's own reviewers before it's used — 5X faster with 100% human oversight, not a claim that removes the underwriter from the loop.
Keeping the reviewer in that position is what makes it human-in-the-loop AI rather than a post-hoc audit: the field is checked before it reaches the file, not after a decision has already been priced off it.
That's a different model from handing workers comp loss run processing off to a BPO with no visibility into how a claim was read. The concern with outsourced processing isn't the vendor category — it's the lack of transparency into how a specific field was extracted or classified. A governed, reviewed extraction step keeps that visibility with the underwriting team, regardless of who's doing the initial read.
Want to see how SortSpoke extracts claim-level workers comp loss run data across carrier formats, under your own team's review? See a demo →
Commercial P&C Insurers Guide to Solving the Underwriting Bottleneck