
The Exception Economy: Why Insurance Document Processing Will Never Be Fully Autonomous
By Brandon Robinson
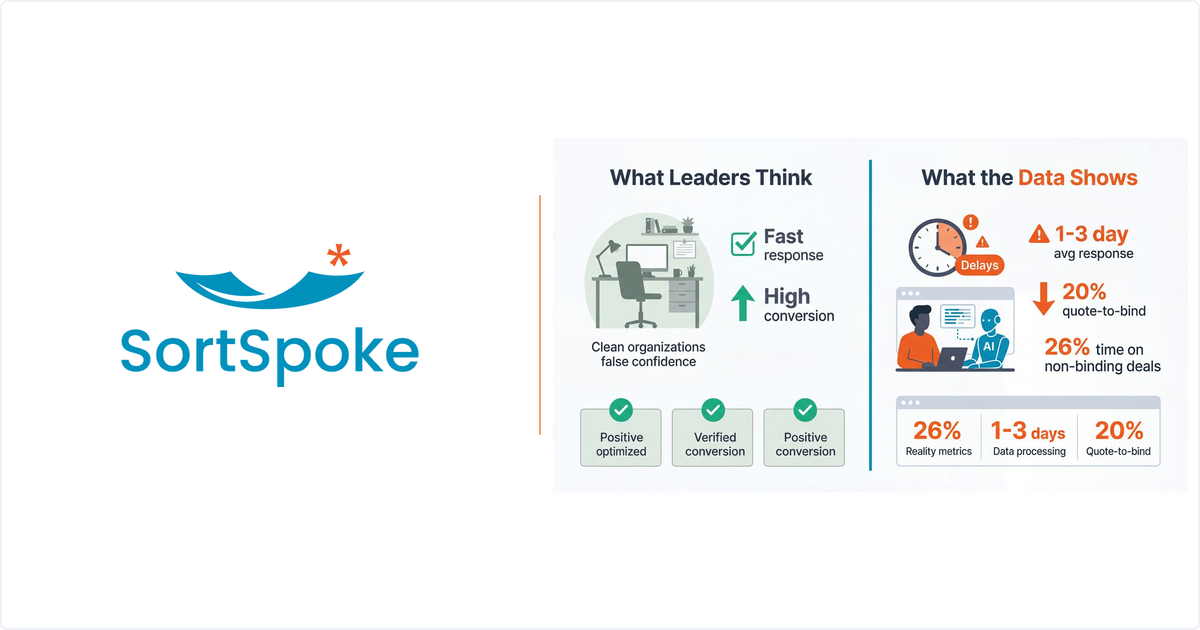
Ask any underwriting leader if their team is efficient, and you'll get a confident yes. Ask them to prove it with data — benchmarked against their specific line of business — and the room gets quiet.
That's not a criticism. It's a structural problem. Most teams measure volume (how many submissions we processed) but not quality (did we process the right submissions, at the right speed, with the right conversion rate?). The difference between those two questions is where millions in premium revenue disappear.
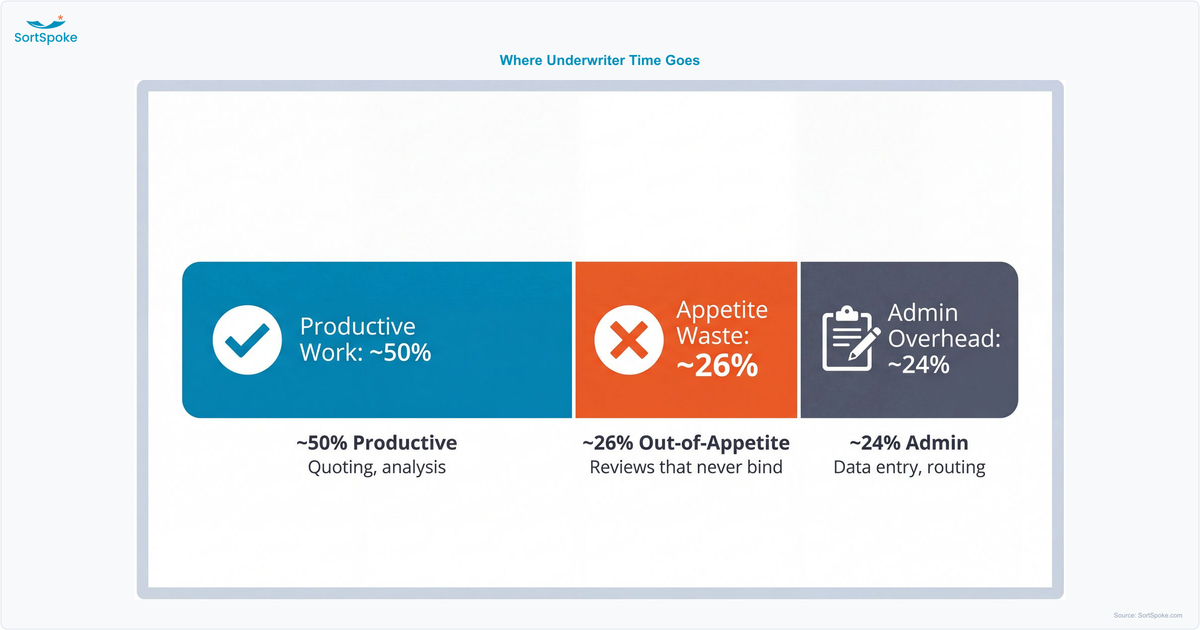
According to Federato's 2025 State of Underwriting Report, underwriters spend roughly 26% of their time on deals that never bind. That's one full day per week — per underwriter — spent triaging, reviewing, and declining submissions that were never a fit in the first place.
The gap between perceived efficiency and actual efficiency is the most expensive blind spot in commercial underwriting. And it starts with not knowing which metrics actually matter.
Not all metrics are equal. These four, weighted by their impact on premium revenue, separate top-performing submission triage operations from the rest.
Here's the stat that should keep underwriting leaders up at night: 78% of buyers purchase from the first carrier to quote, according to Coverager. If your team isn't among the fastest to respond, you're not competing — you're watching.
And brokers have noticed. A Prestige Underwriting survey found that 48% of brokers say carrier response times are "too slow." Worse, 73% of brokers say they move business after two or more slow responses. The average premium at risk per dissatisfied broker relationship? $2.3 million annually.
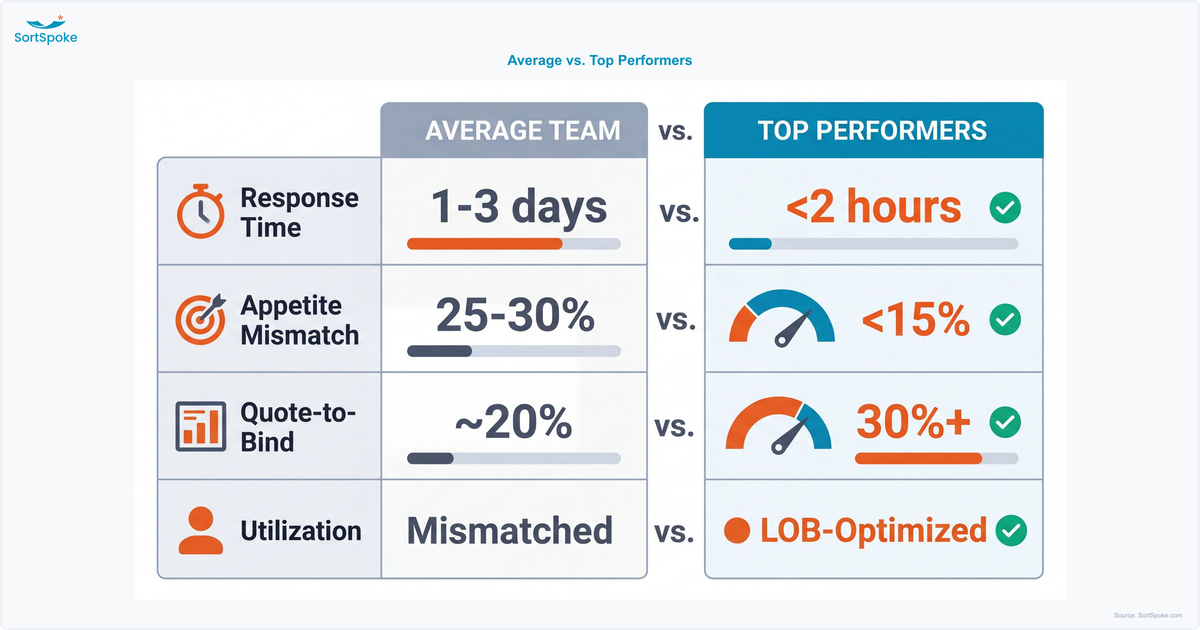
Top-quartile teams achieve a first touch in under 2 hours. The industry reality? Most teams take 1–3 days. That gap isn't just an operational metric — it's a first-responder revenue advantage that compounds with every submission.
Industry average: roughly 25% of submissions fall outside a carrier's appetite. Every one of those out-of-appetite submissions still costs about 30 minutes of underwriter time — opening the file, reviewing basics, deciding to decline, communicating back to the broker.
Run the math on a team processing 200 submissions per week at a 30% mismatch rate. That's 60 wrong-fit submissions consuming 30 hours per week — nearly a full FTE dedicated to work that will never generate a dollar of premium.
The fix isn't saying no faster. It's never seeing the wrong submissions in the first place. Teams that have figured out how to scale without adding headcount almost always start here — by filtering appetite before underwriters touch the file.
Industry average quote-to-bind sits at roughly 20% — one in five quotes actually binds. Top performers hit 25–50%. Most teams track this number religiously. Few track it correctly.
Here's the problem: QTB in isolation is misleading. If 30% of your submissions are out-of-appetite, your "real" conversion rate on viable deals might be much higher than the headline number suggests. Or the problem might be downstream — pricing, turnaround, broker relationships — not upstream intake.
Quote-to-bind only tells the full story when combined with appetite fit. A 20% QTB with 15% mismatch is a fundamentally different problem than 20% QTB with 35% mismatch.
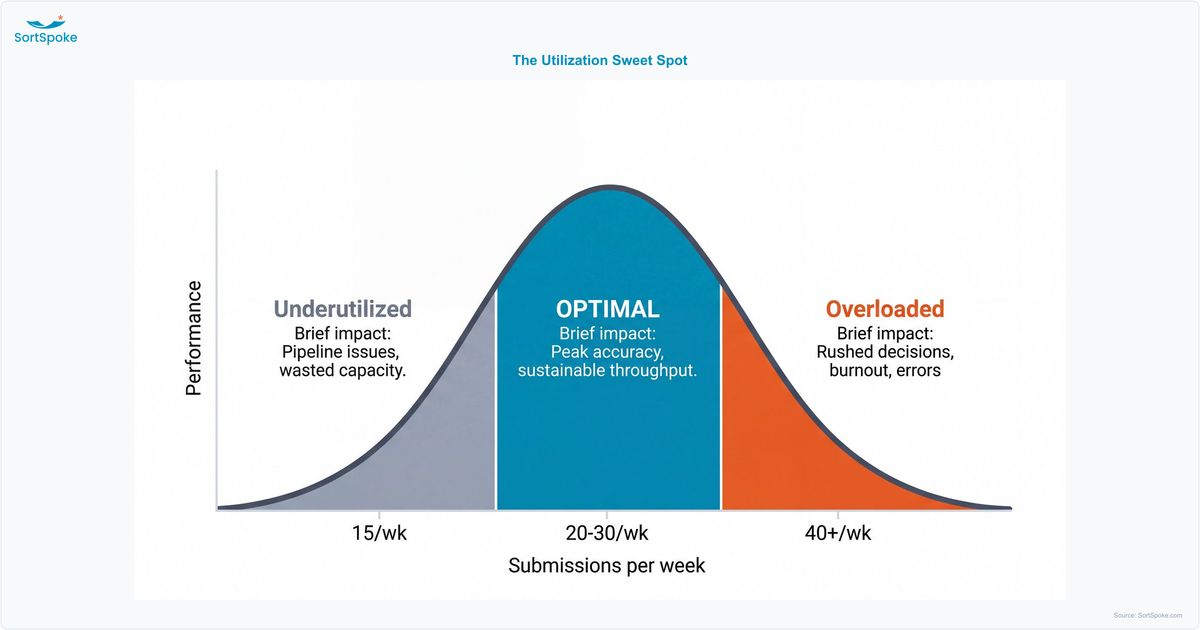
Overloaded underwriters (40+ submissions per week) make rushed decisions, miss details, and burn out. Underutilized teams signal a pipeline or routing problem that's starving capacity you've already paid for.
The optimal range varies by line of business. A property underwriter handling 35 submissions per week might be in the sweet spot, while an E&S underwriter at the same volume is drowning. A single "submissions per underwriter" benchmark doesn't work — it has to be calibrated to your LOB.
The goal isn't maximum throughput. It's right-sized workload matched to the complexity of your book.
Most teams track one or two of these in isolation. The real blind spot is how they compound.
The only way to know your real efficiency is to measure all four together, weighted by their impact on your specific line of business. What's "fast" for E&S isn't the same as general liability. What's "optimal utilization" for workers' comp looks nothing like professional lines.
A single benchmark doesn't cut it. That's why the teams getting this right are using LOB-adjusted frameworks that account for the structural differences in how each line operates.
When you study underwriting teams that consistently score in the top quartile across all four metrics, a pattern emerges. They aren't just faster or luckier. They've made structural decisions that the rest of the market hasn't.
The common thread? These teams have systematized their triage process. Their efficiency doesn't depend on talented individuals working harder — it's built into the workflow itself. And increasingly, the teams pulling ahead are the ones combining structured triage with human-in-the-loop AI to handle the volume without sacrificing the judgment that underwriting demands.
Efficiency isn't about working faster. It's about working on the right submissions, at the right speed, with the right capacity. Most teams don't know where they stand because they've never measured all four dimensions together — benchmarked against their own line of business.
Where does your team actually stand? We built a free Underwriting Efficiency Calculator that scores your submission workflow across all four dimensions — benchmarked against your specific line of business. No signup required. Takes 2 minutes. Calculate Your Efficiency Score →
Commercial P&C Insurers Guide to Solving the Underwriting Bottleneck
Related articles


